New and Used U.S. EV Sales Rise in August
August brought further evidence of a steadily maturing electric vehicle market, according to Cox Automotive’s EV Market Monitor – August 2026. New and used EV sales increased from July, inventory levels moved closer to ICE+ vehicles, and growing off-lease returns continued to expand used EV availability. Lower-priced models also gained share in the new market, helping narrow the price gap between EVs and ICE+ vehicles.
New EV sales totaled an estimated 78,895 units in August, up 2.5% from July but down 46.9% from a year earlier. The sizeable decline was expected because August 2025 set a U.S. record for new EV volume. Growth across several automakers more than offset Tesla’s decline, showing a market becoming less dependent on one brand. EVs represented 5.7% of total new-vehicle sales, essentially unchanged from July.
Tesla led with 40,816 sales, followed by Toyota, Rivian, Hyundai and Cadillac. Tesla sales fell 3.8% from July, reducing its EV share to 51.7%, down 3.4 percentage points. Toyota sales jumped 34.9% to 4,964, led by the bZ, which increased 39.6% and added a full percentage point to its EV share. Chevrolet rose 30.3%, Cadillac 13.1% and Kia 12%.
Used EV sales increased 25.9% month over month and 14.7% year over year to 44,350 units, while EV market share edged up to 2.8%. Tesla, Ford, Hyundai, BMW and Chevrolet were the top five brands. Used Tesla sales increased 26.5%, with nearly 30% of August used EV sales being Tesla models. Nissan rose 45.1%, Cadillac 37.7% and Kia 32.1%. The Model 3, Model Y and Mustang Mach-E recorded the largest monthly volume increases.
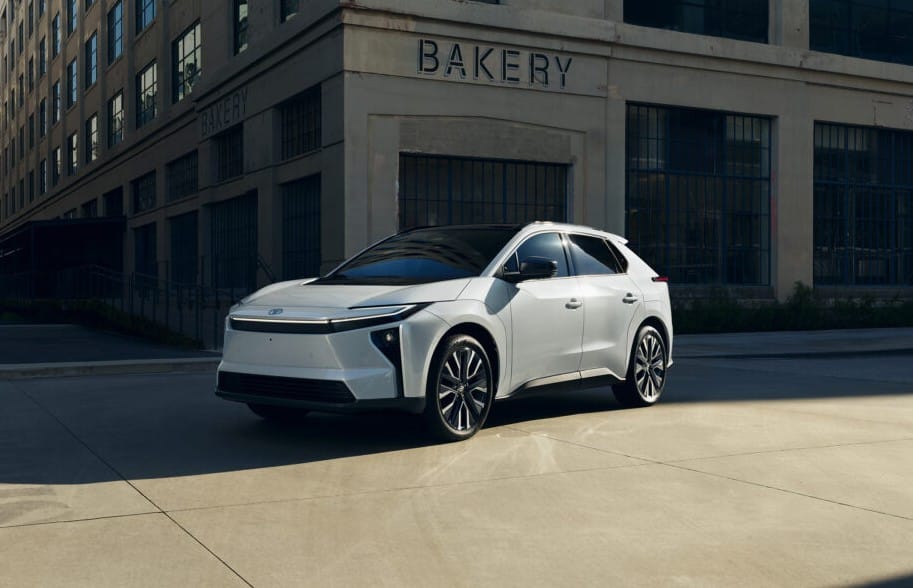
New EV days’ supply fell to 78 days, down 9.6% monthly but up 24% annually, leaving EV inventory just two days above ICE+ levels. Subaru had the lowest supply at 26 days, down from 47, while Porsche and Toyota cut supply by 35 and 33 days. Cadillac, Mercedes-Benz and Audi saw supply increase.
Used EV days’ supply fell 15.4% monthly to 42 days, reaching parity with ICE+ for the first time this year, although it remained 20.2% above last year. Used Hyundai EVs had 36 days of supply, while Mercedes-Benz had 57 days.
The new EV average transaction price declined 1.3% monthly and 2.8% annually to $54,754. Incentives averaged 12% of ATP, or $6,594, down 2.2% from July and 19.9% from a year ago. The EV premium over ICE+ narrowed to $4,847, or 9.7%. Stronger sales of the Toyota bZ, Chevrolet Bolt and Toyota C-HR, along with a 1.9% decline in Tesla Model 3 ATP, contributed to the reduction.
Used EV average listing prices fell 1% monthly to $37,441 but remained 8.2% above last year. The premium over ICE+ narrowed to 7.8%. Tesla prices rose 0.7% while maintaining nearly 30% market share. Lower-priced brands and falling prices among high-volume non-Tesla models drove the overall decline. Cadillac LYRIQ sales increased 46% while its average price fell 2.6%, and Chevrolet Blazer EV sales rose 44% as prices declined 5.7%.
As last year’s tax-credit-driven surge fades, EV inventory is now closely aligned with ICE+ vehicles while expanding off-lease supply continues reshaping the used market. Pricing, incentives and the market’s ability to absorb growing used-EV volumes will be key indicators in the months ahead.
The EV Market Monitor gauges new and used EV market health through sales volume, days’ supply and average pricing, measuring each metric month over month and year over year.
Note: an ICE+ vehicle (Internal Combustion Engine plus) refers to a traditional gasoline- or diesel-powered vehicle, often used by automotive market analysts (such as in Kelley Blue Book or Cox Automotive reports) as a shorthand category that includes standard internal combustion engines as well as traditional hybrids.
U.S. EV Market Shows Signs of Stabilization as Conventional Hybrids Gain Ground
Atlas Public Policy’s August 24, 2026 analysis found that the U.S. EV market was showing signs of stabilization more than 10 months after federal clean vehicle tax credits expired. EV sales had recovered from a multi-year low but remained below 2025 levels.
Light-duty EV sales increased in Q2 2026 after a volatile end to 2025 and weak first-quarter performance. The federal tax-credit expiration had pulled purchases forward, producing record sales before EV volume fell nearly 50% in Q4 2025. About 228,000 EVs were sold in Q1 2026, a 39% year-over-year decline. As gasoline prices increased in March and remained elevated through Q2, monthly EV sales recovered from approximately 62,000 in January to 110,000 in June, the strongest month since the credits expired.
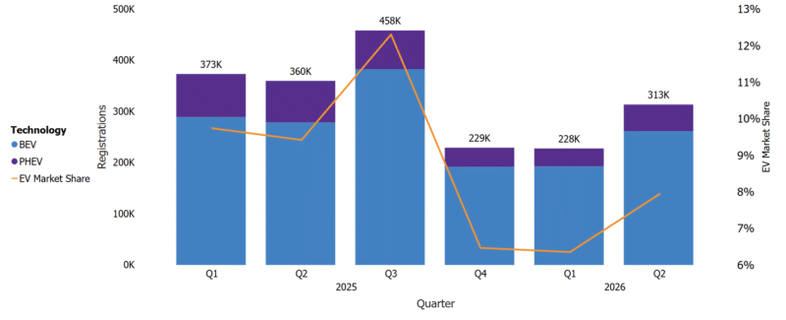
However, plug-in vehicles were not driving the broader growth in electrified transportation. Combined BEV, PHEV and conventional hybrid market share reached 24% in Q2 2026, up from 22% a year earlier. Conventional hybrids accounted for a record 16% of U.S. light-duty vehicle sales, while BEV share declined from 7% to 6% and PHEV share fell from 1.9% to 1.4%.
The shift toward conventional hybrids suggests that rising fuel prices are increasing consumer interest in fuel efficiency, but that interest is not translating evenly across electrified technologies. Conventional hybrids provide incremental fuel savings but do not increase charging demand, support charging infrastructure investment or provide zero-tailpipe-emission transportation.
Atlas Public Policy noted that BEVs and PHEVs remain better positioned for deeper transportation emissions reductions, making their recent slowdown important to monitor. With federal purchase credits gone, continued plug-in adoption may depend more heavily on state and utility programs, charging access, affordability and the expanding used-EV market.
The second half of 2026 will show whether the Q2 recovery represents durable momentum or a smaller, slower-growing U.S. EV market.

Electric Vehicle Marketing Consultant, Writer and Editor. Publisher EVinfo.net.
Services